Raymii.org

Quis custodiet ipsos custodes?Home | About | All pages | Cluster Status | RSS Feed
Bash HTTP monitoring dashboard
Published: 27-12-2020 | Last update: 11-01-2021 | Author: Remy van Elst | Text only version of this article
❗ This post is over three years old. It may no longer be up to date. Opinions may have changed.
Table of Contents
This is a shell script that creates a webpage with the status of HTTP(s) sites. Parallel checking, thus very fast, only dependencies are curl and bash (version 4 or above). For all of you who want a simple script with a nice webpage to check a few websites. Perfect for a wall mounted monitoring display and a Raspberry Pi.
Installation and configuration is easy to do inside the script. It scales well, both on the checking side as the information display page (dense on purpose). Failed checks appear right on top for you to act on.
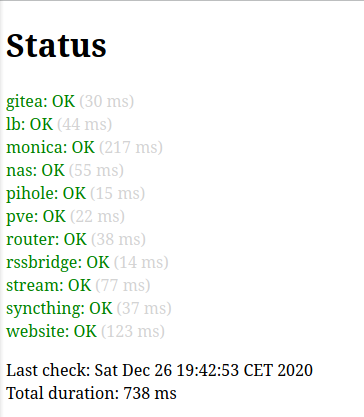
I had this script running at home for at least a year. When I showed it to a friend he liked it, asked me to make it public, but before I did that I polished it up a bit. There is a screenshot of that early version on this page.
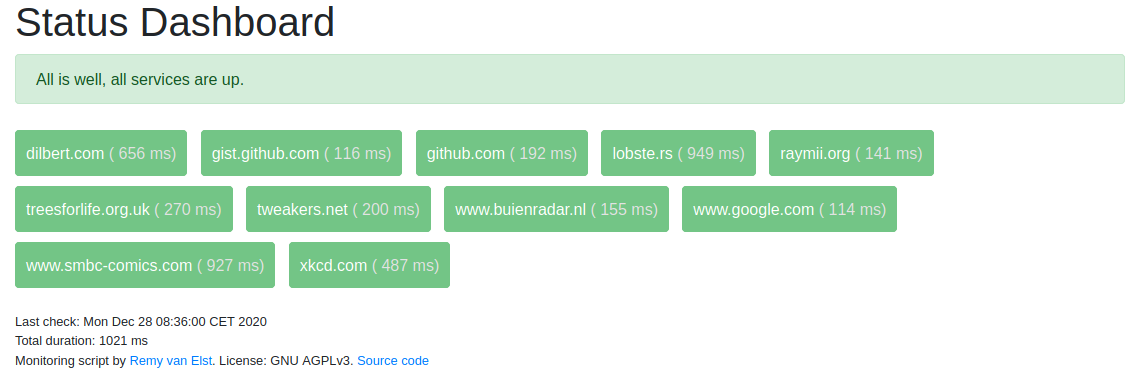
Screenshot when all checks are green:
Recently I removed all Google Ads from this site due to their invasive tracking, as well as Google Analytics. Please, if you found this content useful, consider a small donation using any of the options below. It means the world to me if you show your appreciation and you'll help pay the server costs:
GitHub Sponsorship
PCBWay referral link (You get $5, I get $20 after you've placed an order)
Digital Ocea referral link ($200 credit for 60 days. Spend $25 after your credit expires and I'll get $25!)
You can set an expected status code and a max timeout per check, so if you consider your site up when it returns a 302 (redirect) or 401 (unauthorized) the script consider that okay. If the status code is not what is configured or there is a timeout or another error, the script considers the check failed.
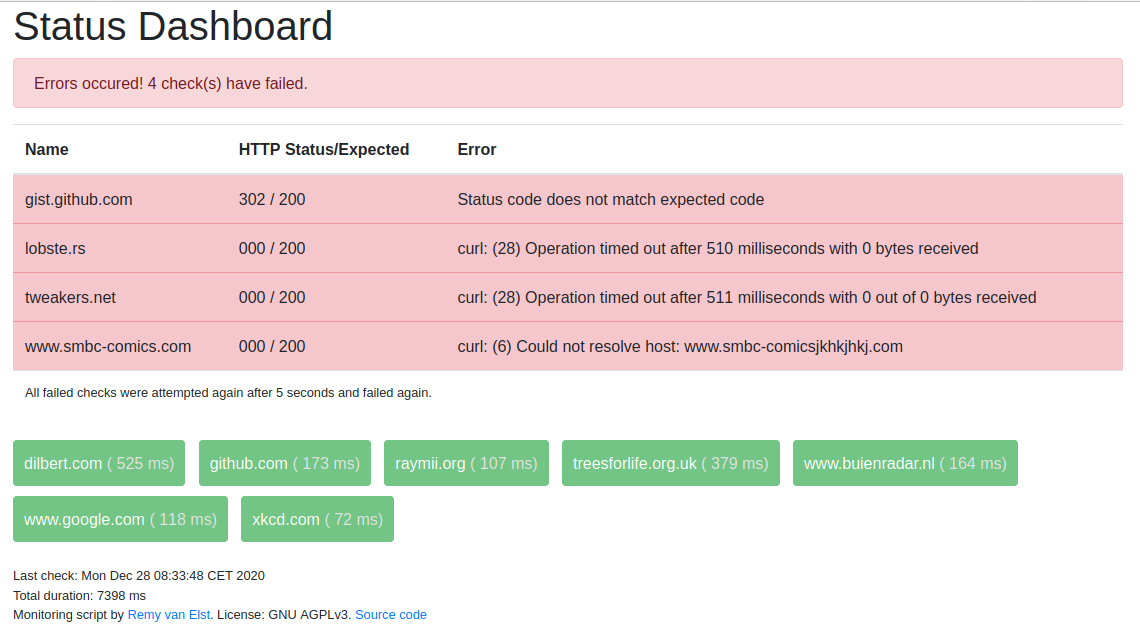
If a check fails, the script will check that specific one again after 5 seconds to prevent flapping.
Source code here on github.
What this does not have:
- Notifications
- History
There however is the option to set a callback_url, whenever a check fails the script will send
the status to that URL, allowing you to set up your own history logging or alerting.
Changelog
- 27-12-2020: Initial release
- 30-12-2020: Added
cgi-bin/dockersupport - 11-01-2021: Added callback URL for failed checks
Installation & Configuration
Make sure you have curl installed (apt install curl). If you need a very
simple webserver, try micro-httpd, by ACME. (apt install micro-httpd).
The scripts outputs HTML directly, so setup involves a cronjob that writes that output to a file. You can view that file locally in a web browser, or place it on a webserver. The cronjob setup is for a webserver.
Clone the git repository:
git clone https://github.com/RaymiiOrg/bash-http-monitoring.git
cd bash-http-monitoring
Edit the srvmon script and add your sites. A few examples are provided. This is the syntax:
urls[gists]="https://gist.github.com"
urls[lobsters]="https://lobste.rs"
urls[raymii.org]="https://raymii.org"
urls[example]="http://example.org:3000/this/is/a/test"
The first part between the square brackets is the name, the second part between the quotes is the URL you want to monitor. It can be just a domain, an IP or an actual URL, including port and such.
If you want to override the default status code for a check, this is the syntax:
statuscode[gists]=302
The first part between the square brackets must match the urls[] part.
Further global configuration options include:
maxConcurrentCurls=12 # How many curl checks to run at the same time
defaultTimeOut=10 # Max timeout of a check in seconds
flapRetry=5 # After how many seconds should we re-check any failed checks? (To prevent flapping)
title="Status Dashboard" # Title of the webpage
cgi=false # Enable or disable CGI header
callbackURL="" # leave empty to disable, otherwise see readme
Execute the script and send the output to a file in your webservers documentroot:
bash srvmon > /var/www/index.html
View that file in a web browser.
CGI header (Docker)
- Update 30-12-2020: This was contributed by rabbit-of-caerbannog
Some HTTP servers, like Apache, support CGI scripts. To make it brief, these are scripts which are handed a HTTP request to reply to.
The main advantage of using the script as a CGI script, is that the page is generated on demand
and as such, provides a live-view on each page load.
If the page is public, this method should be avoided, as it can be easily abused.
If you want to set up CGI mode, you need to copy the script to your server CGI directory.
You can use docker to try this out. Like so:
docker run -d -p 9090:80 -v $PWD/srvmon:/usr/local/apache2/cgi-bin/srvmon hypoport/httpd-cgi
Callback URL
This script does not provide other means of alerting or history. If you do want that, you must do
a bit of work yourself. The script supports a callback url, whenever a check failed, it will
do a POST request to a configurable URL with the status and error. This allows you to setup
logging, history, graphs or otherwise alerting yourself. No examples are provided as of yet but
feel free to open a merge request.
The JSON sent is in the following format:
{
    "url": "The configured URL, URL encoded",
    "name": "The configured name"
    "expected_status": "The configured expected status code", // as a string
    "actual_status": "The actual status code", // as a string
    "error": "descriptive error text (from curl mostly)"
}
Each failed check results in its own request. No bundling is done.
You can use HTTPbin to test locally. HTTPbin is a so called echo server, anything
that is sent to it is returned for debugging purposes. Set this in the config:
callbackURL="http://127.0.0.1:8888/post/"
Run httpbin in a local docker:
docker run -p 8888:80 kennethreitz/httpbin
Configure some failed checks, either a non matching status code or a non-existing domain:
Example json data:
{
    "url": "https%3A%2F%2Fgist.github.com",
    "name": "gist.github.com",
    "expected_status": "309",
    "actual_status": "302",
    "error": "Status code does not match expected code"
}
Another example:
{
    "url": "https%3A%2F%2Fwww.buiekjhkjhkhkhkjhnradar.nl",
    "name": "www.buienradar.nl",
    "expected_status": "200",
    "actual_status": "000",
    "error": "curl: (6) Could not resolve host: www.buiekjhkjhkhkhkjhnradar.nl"
}
Cronjob setup
If you want to set up a cronjob, send the output to a temp file and when finished, move that temp file over the "actual" file. Otherwise you might end up with an incomplete page when the checks are running. Like so:
* * * * * /bin/bash /opt/srvmon/srvmon > /var/www/index.html.tmp && /bin/mv /var/www/index.html.tmp /var/www/index.html
Change the folders/paths to your setup.
If the check fails for whatever reason, the "old" page will not be overridden.
Screenshots
All checks are okay:

A check has failed. All failed checks appear on top:
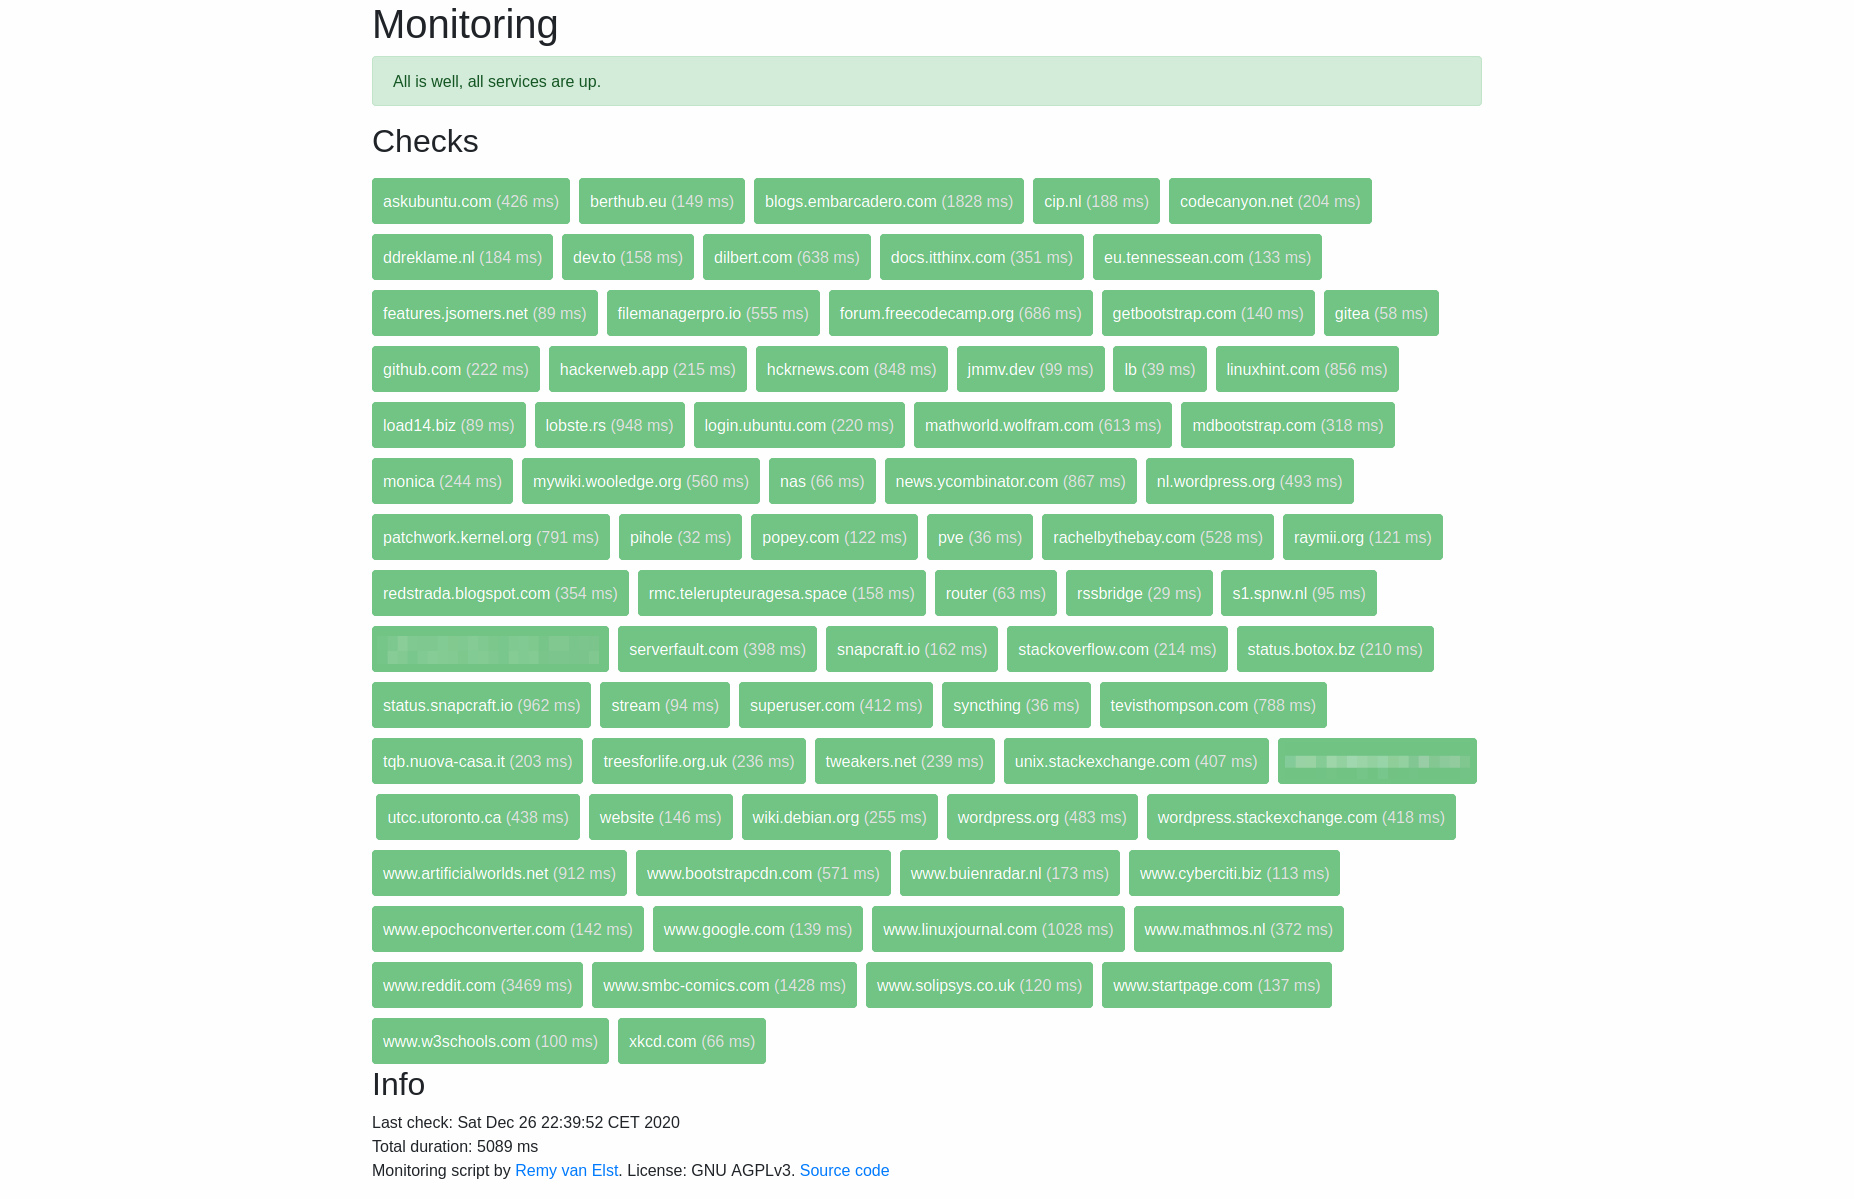
Here is how it looks with many hosts (also note how fast it executes, 5 seconds):
This is what the early version looked like:
